Navigation Instructions

Choose Icon Category:
- Profitability: it exhibits the levels and sources of profitability of the main players in the Puerto Rico Banking Industry through a ROE Tree scheme
- Productivity: it provides the main banking efficiency indicators
- Capital Adequacy: it puts forth the most relevant capital regulatory requirement variables and ratios
- Asset Quality: it reviews the capitalization levels, asset portfolio composition and noncurrent loans and leases analysis
- Liquidity: it provides data on banks’ funding sources, market share of deposits and brokered deposits levels

Choose Main Header Category:
- Intro: it includes the Navigation Instructions for the interface, a list of the abbreviations, a list of glossary terms and sources, and a Legal Disclaimer

Choose Second Level Header Category:
- Overview: an introduction summary
- Navigation Instructions: a comprehensive navigation tutorial for the end user
- Glossary and Sources: a list of abbreviations, glossary of terms and reference list
- Bank Comparison: variable and ratio cross-sectional analysis among banks for a specific quarter
- Time Series: variable and ratio longitudinal analysis among banks through time
- Legal Disclaimer: a legal statement regarding the information provided


Choose ROE Tree Category when in Profitability:
 ,
, ,
, , and
, and  : by selecting any of the four node numbers of the ROE Tree, it will appear a dashboard including all the ratios linked to the adjacent boxes (i.e. selecting a node number)
 : by selecting any of the twelve boxes of the ROE Tree, it will appear a dashboard including the ratio, the numerator and the denominator values (i.e. selecting a box)
 Pre-Tax ROE, Pre-Tax ROA and Assets / Equity
1.1) Pre-Tax ROE, Profit Before Taxes and Shareholders’ Equity
1.2) Pre-Tax ROA, Profit Before Taxes and Total Assets
1.3) Assets / Equity, Total Assets and Shareholders’ Equity
 Pre-Tax ROA, Operating Income / Assets, Operating Expenses / Assets, Loan Impairment Provision / Assets and Non-Operating Income / Assets
1.2.1) Operating Income / Assets, Operating Income and Total Assets
1.2.2) Operating Expenses / Assets, Operating Expenses and Total Assets
1.2.3) Loan Impairment Provision / Assets, Loan Impairment Provision and Total Assets
1.2.4) Non-Operating Income / Assets, Non-Operating Income and Total Assets
 Operating Income / Assets, Net Interest Income / Assets, Commissions and Fees / Assets and Other Income / Assets
1.2.1.1) Net Interest Income / Assets, Net Interest Income and Total Assets
1.2.1.2) Commissions and Fees / Assets, Commissions and Fees and Total Assets
1.2.1.3) Other Income / Assets, Other Income and Total Assets
 Net Interest Income / Assets, Interest Income / Assets and Interest Expense / Assets
1.2.1.1.1) Interest Income / Assets, Interest Income and Total Assets
1.2.1.1.2) Interest Expense / Assets, Interest Expense and Total Assets

Choose Third Level Header Category when in Productivity:
- Efficiency Ratio
- Income / Assets
- Expenses / Assets
- Total Expenses
- Income / Branches
- Personnel Costs

Choose Third Level Header Category when in Capital Adequacy:
- Tier 1 Leverage Ratio
- Tier 1 Risk-based Capital Ratio
- Total Risk-based Capital Ratio

Choose Third Level Header Category when in Asset Quality:
- Noncurrent Loans and Leases Ratio
- Charge-off (Loss) Ratio
- Loan Loss Reserves / Noncurrent Loans and Leases

Choose Third Level Header Category when in Liquidity:
- Brokered Deposits / Total Deposits Ratio

Choose View:
- Year-to-date (YTD): annualized variable and ratio analysis of the current calendar year up to the current quarter
- Quarter: annualized variable and ratio analysis by quarter
- Rolling Average, 4 Quarters: annualized variable and ratio analysis through a moving average of the last four quarters

Choose Bank:
- BPPR : Banco Popular de Puerto Rico
- FB : FirstBank Puerto Rico
- BS : Banco Santander Puerto Rico
- OB : Oriental Bank
- SB : Scotiabank de Puerto Rico
- IND : Puerto Rico Banking Industry

Choose Year:
- Years: observations from 2010 until the most current available year
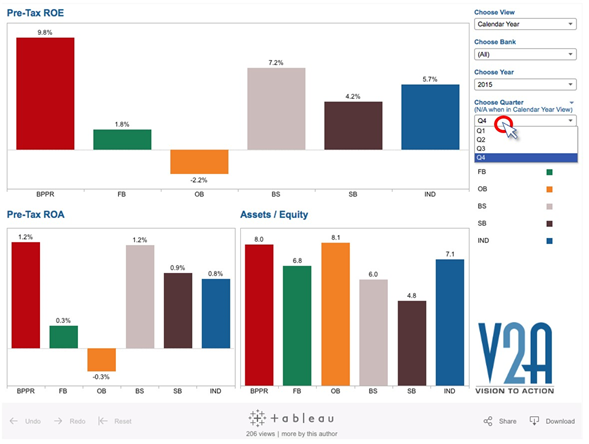
Choose Quarter:
- Quarters: Q1, Q2, Q3 or Q4
- When in Banks Comparison mode and Calendar Year view, Choose Quarter option becomes irrelevant (N/A when in Calendar Year View)

Go to the bank’s website for additional information:
- Select a bank legend color
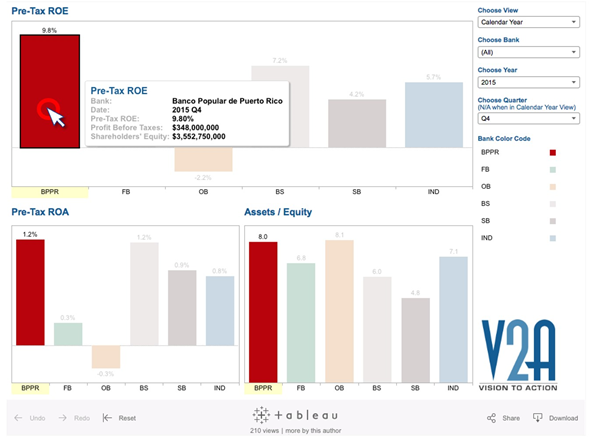
Highlight a Bank (i.e. bar or line) for quickly spot the variable of interest:
- Select a particular bank variable of any chart available in the dashboard
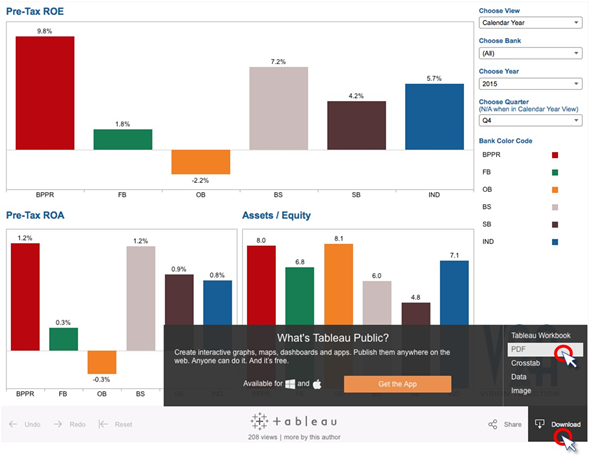
Download dashboards to PDF:
- Choose a dashboard
- Select Download
- Select PDF
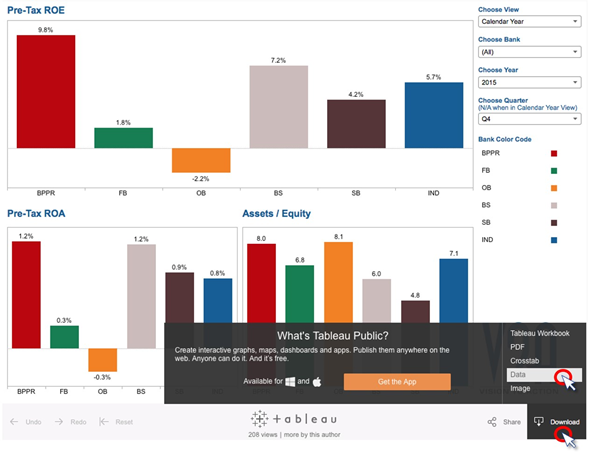
Export dashboards’ charts to Excel:
- Choose a dashboard
- Select a specific chart of the dashboard
- Select Download
- Select Data
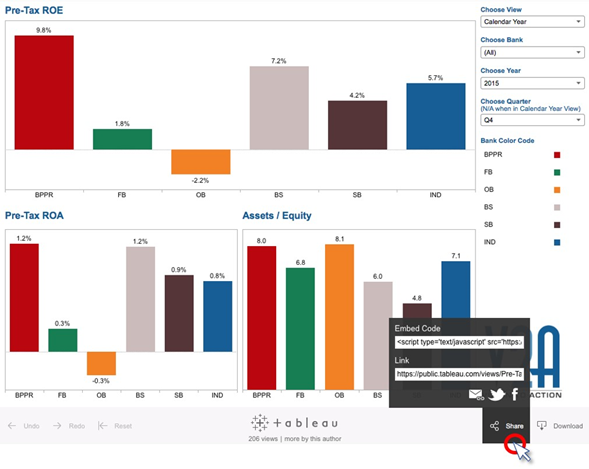
Share reports through email and social media:
- Choose a dashboard
- Select Share
- Choose email, Twitter or Facebook
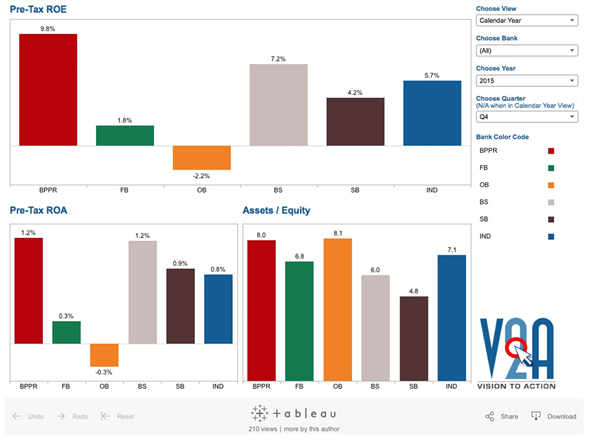
Go to V2A’s website and subscribe to our quarterly Banking Industry Reports, latest news and articles:
- Select V2A logo
- Select Knowledge & Insights
- Subscribe